|
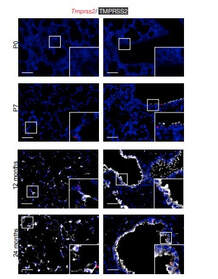
Increased expression of a cellular enzyme called TMPRSS2, well known for its role in prostate cancer was observed to play a role in older individuals coming in contact with the virion. The recent findings, published in the Journal of Clinical Investigation, by a group of researchers at Vanderbilt University Medical Center (VUMC) and their colleagues have determined a key factor as to why COVID-19 appears to infect and sicken adults and older people preferentially while seeming to spare younger children. The study observes that children have lower levels of an enzyme/co-receptor that SARS-CoV-2, the RNA virus, needs to invade airway epithelial cells in the lung. The study supports efforts to block the enzyme to potentially treat or prevent COVID-19 in older people. Jennifer Sucre, MD, assistant professor of Pediatrics (Neonatology), who led the research with Jonathan Kropski, MD, assistant professor of Medicine, reports that their study provides a biologic rationale for why particularly infants and very young children seem to be less likely to either get infected or to have severe disease symptoms. The study team infers that there is still so much to learn about SARS-CoV-2. But this much is known: that after a viral particle is inhaled into the lungs, protein “spikes” that stick out like nail studs in a soccer ball attach to ACE2, a receptor on the surfaces of certain lung cells. A cellular enzyme called TMPRSS2 chops up the spike protein, enabling the virus to fuse into the cell membrane and “break into” the cell. Once inside, the virus hijacks the cell’s genetic machinery to make copies of its RNA genome. Dr. Sucre and Dr. Kropski, have collaborated since 2016 and studied lung diseases in premature infants and adults, the epidemiological patterns observed in the ongoing outbreak made them wonder if TMPRSS2 had something to do with the greater severity of COVID-19 symptoms observed in older people compared to children, specially if children expressed lesser levels of TMPRSS2 and ACE2. Using single-cell RNA-sequencing, which can detect the expression of genes in individual cells of tissues such as the lung, the researchers were able to track the expression of genes known to be involved in the body’s response to COVID-19 over time. Their study indicated that while the gene for ACE2 was expressed at low levels in the mouse lung, “TMPRSS2 stood out as having a really striking trajectory of increased expression during development, later using RNA in situ hybridization, using fluorescent probes, they were able to visualize expression of the TMPRSS2 gene , which increased over time in specific types of epithelial cells that line the lungs. Analyzing human lung specimen obtained across different ages of patients confirmed a similar trajectory in TMPRSS2 expression to what they’d found in mice. These findings allowed the researchers to conclusively underscore the opportunity to consider TMPRSS2 inhibition as a potential therapeutic target for SARS-CoV-2. The research was supported by several grants from National Institutes of Health and the background work for this paper was built upon the collaborative efforts of the Human Cell Atlas (HCA) Lung Biological Network, The Vanderbilt COVID-19 Consortium Cohort, a multi-disciplinary effort to understand more fully why some people are at greater risk of COVID-19 infection and illness. Story source:
Bryce A. Schuler, A. Christian Habermann, Erin J. Plosa, Chase J. Taylor, Christopher Jetter, Nicholas M. Negretti, Meghan E. Kapp, John T. Benjamin, Peter Gulleman, David S. Nichols, Lior Z. Braunstein, Alice Hackett, Michael Koval, Susan H. Guttentag, Timothy S. Blackwell, Steven A. Webber, Nicholas E. Banovich, Jonathan A. Kropski, Jennifer M. S. Sucre. Age-determined expression of priming protease TMPRSS2 and localization of SARS-CoV-2 in lung epithelium. Journal of Clinical Investigation, 2020; DOI: 10.1172/JCI140766 P.S. Content edited for style and length
2 Comments
Serotonin the happy hormone act as a growth factor for the stem cells in the fetal human brain that determine brain size During the evolutionary journey, the size of the brain increased, especially in a particular part called the neocortex. The neocortex enables us to speak, dream and think. In the search of the causes underlying neocortex expansion, researchers at the Max Planck Institute of Molecular Cell Biology and Genetics in Dresden, together with colleagues at the University Hospital Carl Gustav Carus Dresden, identified a number of molecular players. These players typically act cell-intrinsically in the so-called basal progenitors, the stem cells in the developing neocortex with a pivotal role in its expansion. The researchers now report an additional, novel role of the happiness neurotransmitter serotonin which is known to function in the brain to mediate satisfaction, self-confidence and optimism – to act cell-extrinsically as a growth factor for basal progenitors(BPs) in the developing human, but not mouse, neocortex (Ncx). Due to this new function, placenta-derived serotonin likely contributed to the evolutionary expansion of the human neocortex. The team of Wieland Huttner at the Max Planck Institute of Molecular Cell Biology and Genetics, who is one of the institute’s founding directors, has investigated the cause of the evolutionary expansion of the human neocortex in many studies. In a new study from his lab focuses on the role of the neurotransmitter serotonin, the happiness neurotransmitter, because it transmits messages between nerve cells that contribute to well-being and happiness, for a potential role in brain development during in the developing embryo. In humans and mice the placenta produces serotonin, which then reaches the brain via the blood circulation, however, the function of this placenta-derived serotonin in the developing brain has been unknown. The findings of the study has been published in the Cell Press journal Neuron, their study revealed that the serotonin receptor HTR2A was expressed in fetal human, but not embryonic mouse, neocortex (Ncx). Serotonin needs to bind to this receptor in order to activate downstream signaling. To explore if this receptor could be one of the keys to the question of why humans have a bigger brain.” The researchers induced the production of the HTR2A receptor in embryonic mouse neocortex, and found that serotonin, by activating this receptor, caused a chain of reactions that resulted in the production of more basal progenitors in the developing brain. More basal progenitors can then increase the production of cortical neurons, which paves the way to a bigger brain. Conversely, CRISPR/Cas9-mediated knockout of endogenous HTR2A in embryonic ferret Ncx reduces BP proliferation. Pharmacological activation of endogenous HTR2A in fetal human Ncx ex vivo increases BP proliferation via HER2/ERK signaling. Hence, 5-HT emerges as an important extrinsic pro-proliferative signal for BPs, which may have contributed to evolutionary Ncx expansion. Significance for brain development and evolution According to Wieland Huttner, supervisor of the study, "the present study uncovers a novel role of serotonin as a growth factor for basal progenitors in highly developed brains, notably humans and implicates serotonin in the expansion of the neocortex during development and human evolution". He continues: “Abnormal signaling of serotonin and a disturbed expression or mutation of its receptor HTR2A have been observed in various neurodevelopmental and psychiatric disorders, such as Down syndrome, attention deficit hyperactivity disorder and autism. Our findings may help explain how malfunctions of serotonin and its receptor during fetal brain development can lead to congenital disorders and may suggest novel approaches for therapeutic avenues.” Story Source:
Lei Xing, Nereo Kalebic, Takashi Namba, Samir Vaid, Pauline Wimberger, Wieland B. Huttner. Serotonin Receptor 2A Activation Promotes Evolutionarily Relevant Basal Progenitor Proliferation in the Developing Neocortex. Neuron, 2020; DOI: 10.1016/j.neuron.2020.09.034 BLAST (basic local alignment search tool) is an algorithm and program for comparing primary biological sequence information, such as the amino-acid sequences of proteins or the nucleotides of DNA or RNA sequences. BLAST performs “local” alignments, and this is particularly helpful when working with one or more functional domains occurring within a protein. The BLAST algorithm is tuned to find these domains or shorter stretches of sequence similarity. Moreover, the local alignment approach also means that an mRNA can be aligned with a piece of genomic DNA, as its is frequently required in genome assembly and analysis. BLAST works by finding regions of local similarity between sequences comparing nucleotide or protein sequences to sequence databases and it also calculates the statistical significance of matches, and displays a “expect value” or e-value that estimates how many matches would have occurred at a given score by chance, which can aid a user in judging how much confidence to have in an alignment. Uses of BLAST BLAST can be used for several purposes such as identification of species, locating domains, establishing phylogeny, DNA mapping, and Sequence comparisons. Identification of species: With the use of BLAST, we can correctly identify a species or find homologous species. This can be useful, for example, when you are working with a DNA sequence from an unknown species. Locating domains: When working with a protein sequence you can input it into BLAST, to locate known domains within the sequence of interest. Establishing phylogeny: Using the results received through BLAST you can create a phylogenetic tree using the BLAST web-page. Phylogenies based on BLAST alone are less reliable than other purpose-built computational phylogenetic methods, so should only be relied upon for "first pass" phylogenetic analyses. DNA mapping: When working with a known species, and looking to sequence a gene at an unknown location, BLAST can compare the chromosomal position of the sequence of interest, to relevant sequences in the database(s). NCBI has a "Magic-BLAST" tool built around BLAST for this purpose.[30] Sequence Comparison: When working with genes, BLAST can locate common genes in two related species, and can be used to map annotations from one organism to another. Therefore BLAST has proven itself to be an important tool for studying functional and evolutionary relationships between sequences as well as help identify members of gene families. 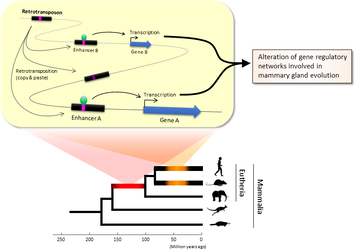 Figure 1. Retrotransposons have been co-opted to act as enhancers in the mammalian genome. Transposable elements known as retrotransposons duplicate themselves via a copy-and-paste mechanism. Tens of thousands of these sequences were found to contain binding sites for proteins that act as master regulators of mammary gland development. Figure 1. Retrotransposons have been co-opted to act as enhancers in the mammalian genome. Transposable elements known as retrotransposons duplicate themselves via a copy-and-paste mechanism. Tens of thousands of these sequences were found to contain binding sites for proteins that act as master regulators of mammary gland development. Transposable elements (TEs), so-called selfish DNA sequences, are known to be capable of moving around the genome through cut-and-paste or copy-and-paste mechanisms, and our human genome contains approx 4.5 million copies of these TEs. This can not be termed as one obscure event as they account for 30-50% of mammalian DNA. The trnasposable elements have been traditionally considered as genetic freeloaders hitchhiking along in the genome without providing any benefit to the host organism. More recently, however, scientists have begun to uncover cases in which TE sequences have been co-opted by the host to provide a useful function, such as encoding part of a host protein. In a recent study published in the journal Nucleic Acids Research, Professor Hidenori Nishihara from Department of Life Science and Technology, Tokyo Institute of Technology, who has undertaken one of the most comprehensive analyses of TE sequence co-option to date, uncovers tens of thousands of potentially co-opted TE sequences and the findings suggest that the TEs might have played a key role in mammalian evolution. Talking about his research Professor Nishihara says that "I was specifically interested in the potential influence of TE sequences on the evolution of the mammary gland, an organ that is responsible for producing milk and is, as the name suggests, a key distinguishing feature of mammals." To identify potentially co-opted TE sequences, Dr. Nishihara used four proteins—ERα, FoxA1, GATA3, and AP2γ—that bind to DNA to regulate the production of proteins involved in mammary gland development, and located all of the DNA sequences in the genome to which these proteins bind. Surprisingly, 20–30% of all of the binding sites across the genome were located in TEs, with as many as 38,500 TEs containing at least one binding site. The majority of these were in a copy-and-paste type of TE known as a retrotransposon, which duplicates itself, leaving a new copy in a new location. The TE-derived binding site sequences were more conserved across species than expected, indicating that they are being preserved by evolution because they serve some important function. Dr. Nishihara believes that these TE sequences have been co-opted to serve as enhancers, DNA elements that increase the transcription of nearby genes (Fig. 1). By binding to one of the four master regulators of mammary gland development, these enhancers ultimately increase the production of proteins involved in mammary gland development. Dr. Nishihara then investigated when in mammalian evolution these TE sequences were acquired and found two distinct phases of acquisition: roughly 60–70% were acquired in the ancestor of all placental mammals (Eutheria), while 10–20% could be traced back to the ancestor of New World monkeys (Simiiformes) (Fig. 2, left). In addition, there appeared to be another wave of acquisition of ERα binding sites in the ancestor of mice and rats (Muridae) (Fig. 2, right). Thus, by providing a vast number of potential regulatory element binding sites throughout the genome, TEs may have had a substantial impact on the emergence of the mammary gland and its evolution within mammals. 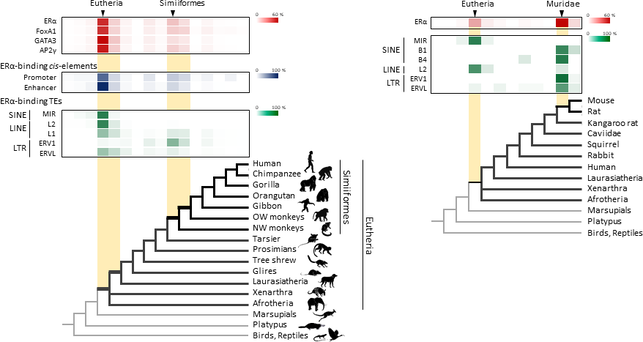 Figure 2. Transposable element-derived binding sites were acquired during distinct phases in mammalian evolution. Left: Among the TE-derived binding sites identified, 60–70% were acquired in the ancestor of placental mammals (Eutheria), while 10–20% were acquired in the ancestor of New World monkeys (Simiiformes). Right: Many ERα binding sites were also acquired in the ancestor of mice and rats (Muridae). Dr. Nishihara's study sheds light on the deep involvement of TEs in the evolution of mammary gland regulatory elements. However, it remains unclear how common this mode of TE-mediated regulatory network evolution is. Dr. Nishihara, at least, believes that the mammary gland is not unique in this respect. He notes that, "in addition to mammary glands, mammals share many features, such as the neocortex, closed secondary palate, and hair. I expect future research to uncover many additional kinds of TEs that have been similarly involved in the evolution of these features in mammals." References
One of the oldest desire of man kind is to increase its life expectancy and if possible be immortal. In pursuit of this dream countless have spent their lives searching for elixir of immortality to fountains of youth, often leading to pain and animosity between fellow humans. Japan, a country owing to its cultural, behavioral and numerous genetic factors has been blessed with many centenarians and currently has the greatest number of known centenarians of any nation with 67,824 according to their 2017 census, along with the highest proportion of centenarians at 34.85 per 100,000 people. Thus Japan becomes the primal choice for conducting studies reflecting on the secrets of longer life and it can be performed with accuracy and a larger statistical sample size compared to other nations. In a latest set of findings research teams of scientists from the RIKEN Center for Integrative Medical Science (IMS) and Keio University School of Medicine in Japan have shown us that all the while we have been looking in the wrong direction and the solution and clue to long life was within our body's own defense / the immune system. Supercentenarians -- meaning people over the age of 110 --as their study interest the teams have discovered an interesting finding that the supercentenarians proved to be an unique group of people having a higher count of specific immune cells cytotoxic CD4+ T-cells, when they compared their cell count with a group of supercentenarians and younger controls. They acquired a total of 41,208 cells from seven supercentenarians (an average of 5,887 per subject) and 19,994 cells for controls (an average of 3,999 per subject) from five controls aged in their fifties to eighties. The study revealed two interesting findings:
Kosuke Hashimoto of IMS, the first author of the paper, expressed the team's stand as "We were especially interested in studying this group of people, because we consider them to be a good model of healthy aging, and this is important in societies like Japan where aging is proceeding rapidly." IMS Deputy Director Piero Carninci, one of the leaders of the groups, says, "This research shows how single-cell transcription analysis can help us to understand how individuals are more or less susceptible to diseases. CD4-positive cells generally work by generating cytokines, while CD8-positive cells are cytotoxic, and it may be that the combination of these two features allows these individuals to be especially healthy. We believe that this type of cells, which are relatively uncommon in most individuals, even young, are useful for fighting against established tumors, and could be important for immunosurveillance. This is exciting as it has given us new insights into how people who live very long lives are able to protect themselves from conditions such as infections and cancer." Their research, is published in journal of Proceedings of the National Academy of Sciences (PNAS), and the study was performed by a collaboration including scientists from the RIKEN Center for Integrative Medical Sciences and Keio University School of Medicine. References
The beginning of a long quest
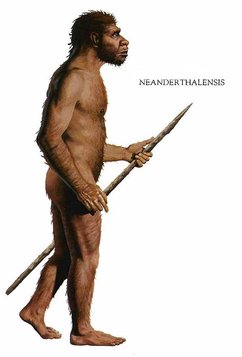
It was the year 1856 when few limestone excavators working near Düsseldorf, Germany, unveiled bones that resembled to humans and initial analysts inferred them as belonging to a deformed human, citing their oval shaped skull, with a low, receding forehead, distinct brow ridges, and bones that were unusually thick. It was only subsequent studies that revealed that the remains belonged to a previously unknown species of hominid, or early human ancestor, that was similar to our own species, Homo sapiens. In 1864, the specimen was dubbed Homo neanderthalensis, after the Neander Valley where the remains were found.Neanderthals rose to prominance around 200,000 and 250,000 years ago and ruled the hills and grasslands of europe till extiction around 30000 years ago. The exact date of their extinction had been disputed but in 2014, a team led by Thomas Higham of the University of Oxford used an improved radiocarbon dating technique on material from 40 archaeological sites to show that Neanderthals died out in Europe between 41,000 and 39,000 years ago, with the last group disappearing from southern Spain 28,000 years ago. Similarity of Neanderthals with Rhodesian Man (Homo rhodesiensis) made early investigators infer that they share similar ancestor but comparison of the DNA of Neanderthals and Homo sapiens suggests that they diverged from a common ancestor between 350,000 and 400,000 years ago, which some argue might be Homo rhodesiensis but this argument assumes that H. rhodesiensis goes back to around 600,000 years ago. However one can not rule out convergent evolutionary paths for the two hominids displaying feathres such as distinct brow ridges. Neanderthals settled in Eurasia, but not extending beyond modern day Israel. No neanderthal sites were observed in the African continent and Homo sapiens appears to have been the only human type in the Nile River Valley because of the warmer climate present in that period. Are Neanderthals really extinct? Sudden disappearnce of Neanderthals from Europe co-incides with the arrival of H. sapiens and this information prompted many scientists to suspect that the two events are closely linked, and humans contributed to the demise of their close cousins, either by outcompeting them for resources or through open conflict. The hypothesis that early humans violently replaced Neanderthals was first proposed by French palaeontologist Marcellin Boule (the first person to publish an analysis of a Neanderthal) in 1912. However according to a 2014 study by Thomas Higham and colleagues based on organic samples suggest that the two different human populations shared Europe for several thousand years. Therefore outright violent extinction seems less plausible and leads to the formation of two scenarios for Neanderthal extinction. Possible scenarios for the extinction of the Neanderthals are:
Ancient DNA to the rescue
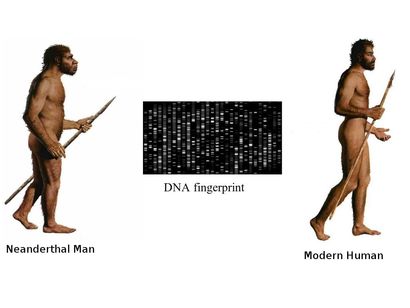
DNA sequence analysis of the fossils can reveal an entirely new world of information to us, but recovering DNA from samples that are fossilized thousands of years ago, is a daunting task in itself making ancient DNA research far from routine. The samples are prone to degradtion and contamination by DNA from other sources, and retriving data out of the ancient material is costly and painstaking work. At a more fundamental level, it requires determining whether the necessary samples even exist and, if so, how to get access to them. The revelations An international group of Anthropologists from Max Planck Institute for Evolutionary Anthropology, Cold Spring Harbour Laboratories and Cornell University using various different methods of DNA analysis estimated an interbreeding to have happened less than 65,000 years ago, around the time that modern human populations spread across Eurasia from Africa. They reported evidences for a modern human contribution to the Neanderthal genome. Martin Kuhlwilm, co-first author of the new paper, identified the regions of the Altai Neanderthal genome sharing mutations with modern humans. They found evidences of gene flow from descendants of modern humans into the Neanderthal genome to one specific sample of Neanderthal DNA recovered from a cave in the Altai Mountains in southern Siberia, near the Russia-Mongolia border. Earlier studies have observed that DNA of modern humans contains 2.5 to 4 percent Neanderthal DNA. However studies conducted by Mendez et. al. revealed that no Neanderthal Y chromosomal DNA was ever observed in any human sample they have tested. Contemplating upon the observations they initially felt that the Neanderthal Y chromosome genes could have drifted out of the human gene pool by chance over the millennia, or there are possibilities that the Neanderthal Y chromosomes include genes that are incompatible with other human genes. Mendez, and his colleagues have found evidence supporting this idea, and they think that the two groups may have been reproductively isolated unlike thought earlier. Their study identified protein-coding differences between Neandertal and modern human Y chromosomes. Changes included potentially damaging mutations to PCDH11Y, TMSB4Y, USP9Y, and KDM5D, and three of these changes are missense mutations in genes producing male-specific minor histocompatibility (H-Y) antigens. Antigens derived from KDM5D, for example, are thought to elicit a maternal immune response during gestation. It is possible that these incompatibilities at one or more of these genes played a role in the reproductive isolation of the two groups. Thus Y-chromosomal studies have re-drawn the time-line of divergence of the two species ~4 million years ago, which according to previous estimates based on mitochondrial DNA put the divergence of the human and Neanderthal lineages at between 400,000 and 800,000 years ago. New data emerging out of GWA studies could shed further light on the evolutionary history of the two hominids. In my opinion the image could resolve better if we look into the pathogen associated and immune response genes that we might have inherited or acquired during our evolutionary journey. Reference:
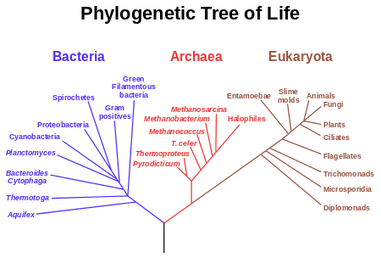
It was Charls Darwin in 1859 who first sketched the evolutionary tree in his book The Origin of Species, and since then trees have remained a central metaphor in evolutionary biology even the present day. Today, phylogenetics (Greek: phylé, phylon = tribe, clan, race +genetikós = origin, source, birth)– is the study of the evolutionary history and relationships among individuals or groups of organisms therefore evolutionary trees—have permeated within and increasingly outside evolutionary biology and fostering skills in reading and interpreting trees are therefore a critical component of biological education. Conversely, misconceptions and erroneous understanding of the evolutionary trees can be very detrimental to one’s understanding of the patterns and processes that have occurred in the history of life.
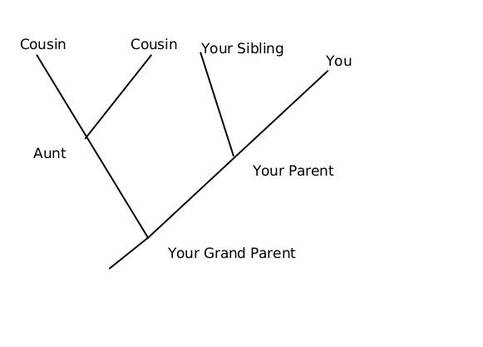
This article is aimed as an aide to students and enthusiasts to read and interpret a phylogenetic tree, however it does not intend to teach how to create one. We can discus that in a separate article later. So what is an Evolutionary Tree anyway? In the most simplistic terms, an evolutionary tree—also known as a phylogenetic tree/ cladogram is a 2D graph or diagram depicting biological entities (sequences or species) that are connected through common descent (i.e. their evolutionary relationship). Thus evolutionary trees provide us some basic information regarding: historical pattern of ancestry, divergence, and descent, by depicting a series of branches that merge at points representing common ancestors, which themselves are connected through more distant ancestors. Consider the tree shown below, here you and your siblings share a common ancestor (your parents) and your parents and aunt with their parents, however you and your cousins share the same ancestry but have divergent origins.
Components of a tree
A typical phylogenetic tree as shown above consists of the following components
What's the difference between a dendogram, a phylogenetic tree, and a cladogram? For general purposes, not much, and many biologists, often use these terms interchangeably. However in the most general terms, tree diagrams are known as “dendrograms” (after the Greek for tree), cladogram only represent a branching pattern; i.e., its branch spans do not represent time or relative amount of character change. While in contrast,trees known as phylograms or phylogenetic trees present branch lengths as being proportional to some measure of divergence between species and typically include a scale bar to indicate the degree of divergence represented by a given length of branch. Homology Vs Similarity Now you may say that since closely related species share a common ancestor and often resemble each other, it might seem that the best way to uncover the evolutionary relationships would be with overall similarity? Surprisingly the answer would be No, and to understand why is it so? we will have to look deeper into the difference between similarity and homology. Similarity may be misleading as because when unrelated species adopt a similar way of life, their body parts may take on similar functions and end up resembling one another due to convergent evolution and result in the formation of analogous features. One classical example is the wings of birds and bats. However when two species have a similar characteristic because it was inherited by both from a common ancestor, it is called a homologous feature (or homology). For example, the even-toed foot of the deer, camels, cattle, pigs, and hippopotamus is a homologous similarity because all inherited the feature from their common paleodont ancestor.
How to read a Phylogenetic tree?
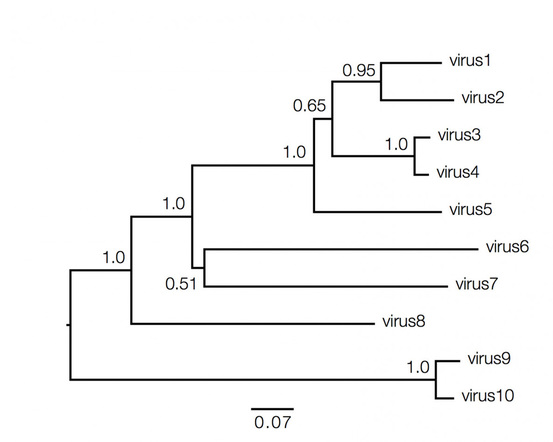
Phylogenetic trees contain a lot of information which can be both qualitative and quantitative, and decoding them is not always straightforward and requires understanding of the above basic facts. Consider the hypothetical tree of different viruses shown below:
Qualitatively here the length of the branches in horizontal dimension gives the amount of genetic change, thus the longer the branch is, larger is the amount of change. While the quantitative information regarding the amount of genetic change is given by the bar at the bottom of the figure which acts as a scale for this. In this case the line segment with the number '0.07' shows the length of branch that represents an amount genetic change of 0.07. The units of branch length are nucleotide substitutions per site – that is the number of changes or 'substitutions' divided by the length of the sequence. The scale may also sometimes represent the % change, i.e., the number of changes per 100 nucleotide sites.
However the vertical lines joining the nodes has no meaning and is used simply to lay out the tree for better visual understanding.
Different presentation schemes of evolutionary trees
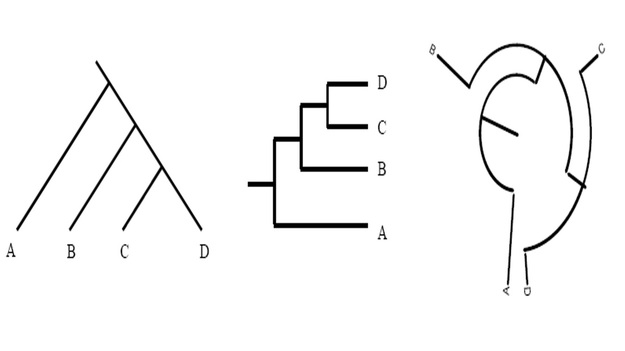
Unless indicated otherwise, a phylogenetic tree only depicts the branching history of common ancestry. The pattern of branching (i.e., the topology) is what matters here. Branch lengths are irrelevant. Thus, the three trees shown in here all contain the same information.
This might seem confusing to you at first, but however do remember that that the lines of a tree represent evolutionary lineages--and evolutionary lineages do not have any true position or shape. Therefore it doesn't matter whether branches are drawn as straight diagonal lines, or are kinked to make a rectangular tree, or are curved to make a circular tree.
To further simplify the concept, consider them as flexible pipes rather than rigid rods; similarly, nodes as swivel joints rather than fixed welds. The basic rule is that if you can change one tree into another tree simply by twisting, rotating, or bending branches, without having to cut and reattach branches, then the two trees have the same topology and therefore depict the same evolutionary history. Reference
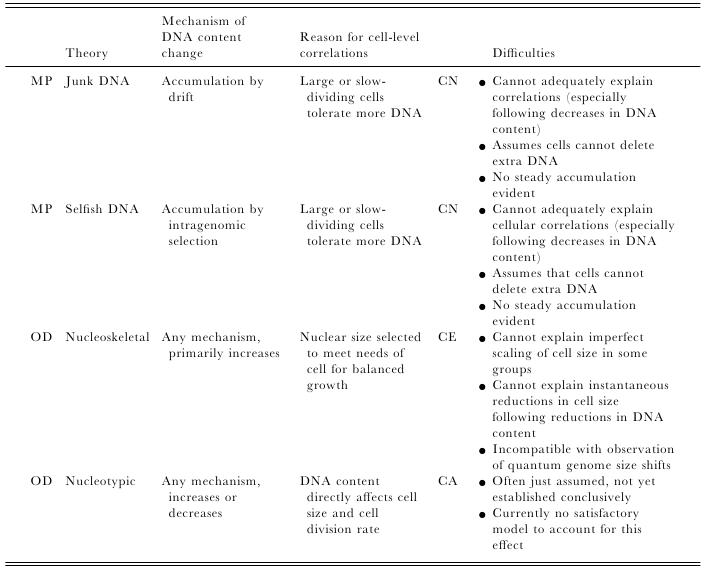
Most of us grow up listening, reading and learning the fact that we "Human" beings can boast of being the most evolved and a higher organism. Earlier than 1960, the image below would have been correct and sensible. However our idea of supremacy in terms of genome size and number of genes takes a flak when we first started looking at the complexity of genome size, it was soon realized that the large genomes were often composed of huge chunks of repetitive DNA, while only a few percent of the genome in these organisms were unique. Now lets have a look at the past and try to figure out the origin of this concept. 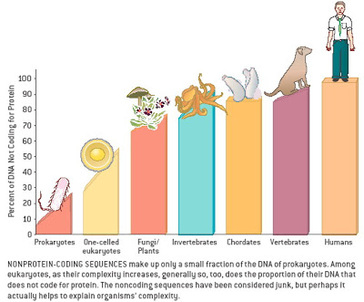 Classically biologists recognize that the living world comprises two types of organisms. Prokaryotes and Eukaryotes. Assuming that you already know what prokaryotes and eukaryotes are, I am not going to dive into the difference between the two. So what is C-value? 'C-value ', of an organism is defined as the total amount of DNA contained within its haploid chromosome set. Prokaryotic cells typically have genomes smaller than 10 megabases (Mb), while the genome of single cell eukaryote is typically less than 50Mb. Therefore for simplicity's sake here we are not comparing the genomes from two classes of organisms together. However eukaryotes alone show immense diversity among their genome sizes, from the smallest eukaryote being less than 10 Mb in length, and the largest over 100 000 Mb, and all these observation seems coinciding to a certain extent with the complexity of the organism, the simplest eukaryotes such as fungi having the smallest genomes, and higher eukaryotes such as vertebrates and flowering plants having the largest ones. So it seems fair to think that, complexity of an organism is related to the number of genes in its genome - higher eukaryotes need larger genomes to accommodate the extra genes. However, in fact this correlation is far from being precise: if it were, then the nuclear genome of the yeast S. cerevisiae, which at 12 Mb is 0.004 times the size of the human nuclear genome, would be expected to contain 0.004 × 35 000 genes, which is just 140. In fact the S. cerevisiae genome contains about 5800 genes! Therefore for many years this lack of precise correlation between the complexity of an organism and the size of its genome was looked on as a bit of a puzzle, and called as C-value paradox/C-value enigma. Questions raised by C-value paradox The C-value paradox not only represents one question, but it rather raises three of them, as suggested by T. R. Gregory(2007), 1) the generation of large-scale variation in genome size, which may occur by continuous or quantum processes, (2) the non-random distributions of genome size variation, whereby some groups vary greatly and others appear constrained, and (3) the strong positive relationship between C-value and nuclear and cell sizes and the negative correlation with cell division rates. Therefore any proposed solution must try to solve these three problems as well. Now we biologists are pretty good at dividing ourselves among different school of thoughts (remember the RNA and DNA world!) and the C-value paradox wasn't an exception either. Nonetheless two school of thoughts emerged here too, one proposing Mutation pressure theories and the other proposing Optimal DNA theories. The table shown below summarizes the theories proposed along with their proposed mechanism. Each theory can be classified according to its explanation for the accumulation or maintenance of DNA (MP,mutation pressure theory ; OD, optimal DNA theory) and according to its explanation for the observed cellular correlations (CN, coincidental, CE, coevolutionary, CA, causative). Note that these theories are not necessarily mutually exclusive in all respects, since the optimal DNA theories do not specify the mechanism(s) of DNA content change and can include those presented by both mutation pressure theories. (ref: GREGORY, T. R. (2001),page # 69) So what is the most plausible explanation of C-value paradox? In 1980s, two landmark papers, by Orgel and Crick and by Doolittle and Sapienza, established a strong case against 'selfish DNA elements' which we better know as transposons. They proposed that ‘selfish DNA’ elements, such as transposons, essentially act as molecular parasites, replicating and increasing their numbers at the (usually slight) expense of a host genome, i.e these elements functions for themselves while providing little or no selective advantage to the host. Computational genomic studies have shown that transposable elements invade in waves over evolutionary time, sweeping into a genome in large numbers, then dying and decaying away leaving the 'Junk DNA' in its trail. 45% of the human genome is detectably derived from these transposable elements. Therefore we can say that C-value paradox is mostly (though not entirely) explained by different loads of leftovers from transposable elements and larger the genomes longer is the trail leftover by transposons. So, if the C-value paradox is explained and rested for good, why dig it up again? Recent publications discussing the outcome of ENCODE (Encyclopedia Of DNA Elements) project suggest that 80% of the human genome is reproducibly transcribed, bound to proteins, or has its chromatin specifically modified. Moreover the previously considered junk DNA is found to be biochemically active disapproving the 'Junk DNA' theory. Now in the light of ENCODE data it is pertinent that scientists need to come up with a alternative hypothesis capable of explaining C-value paradox, for mutational load, and for how a large fraction of eukaryotic genomes is composed of neutrally drifting transposon-derived sequences. Reference:
|
AuthorHello! My name is Arunabha Banerjee, and I am the mind behind Biologiks. Leaning new things and teaching biology are my hobbies and passion, it is a continuous journey, and I welcome you all to join with me Archives
June 2024
Categories
All
|



 RSS Feed


