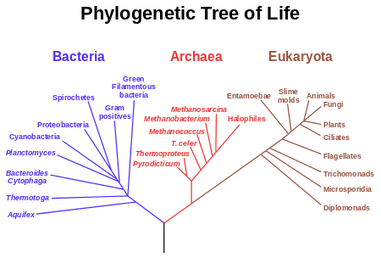
It was Charls Darwin in 1859 who first sketched the evolutionary tree in his book The Origin of Species, and since then trees have remained a central metaphor in evolutionary biology even the present day. Today, phylogenetics (Greek: phylé, phylon = tribe, clan, race +genetikós = origin, source, birth)– is the study of the evolutionary history and relationships among individuals or groups of organisms therefore evolutionary trees—have permeated within and increasingly outside evolutionary biology and fostering skills in reading and interpreting trees are therefore a critical component of biological education. Conversely, misconceptions and erroneous understanding of the evolutionary trees can be very detrimental to one’s understanding of the patterns and processes that have occurred in the history of life.
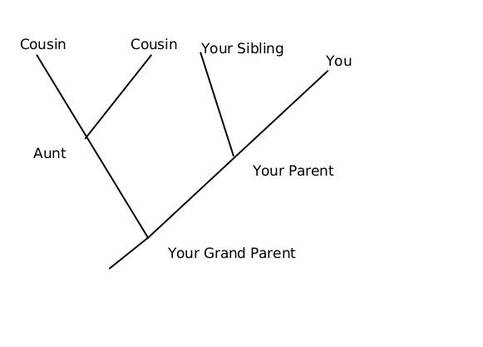
This article is aimed as an aide to students and enthusiasts to read and interpret a phylogenetic tree, however it does not intend to teach how to create one. We can discus that in a separate article later. So what is an Evolutionary Tree anyway? In the most simplistic terms, an evolutionary tree—also known as a phylogenetic tree/ cladogram is a 2D graph or diagram depicting biological entities (sequences or species) that are connected through common descent (i.e. their evolutionary relationship). Thus evolutionary trees provide us some basic information regarding: historical pattern of ancestry, divergence, and descent, by depicting a series of branches that merge at points representing common ancestors, which themselves are connected through more distant ancestors. Consider the tree shown below, here you and your siblings share a common ancestor (your parents) and your parents and aunt with their parents, however you and your cousins share the same ancestry but have divergent origins.
Components of a tree
A typical phylogenetic tree as shown above consists of the following components
What's the difference between a dendogram, a phylogenetic tree, and a cladogram? For general purposes, not much, and many biologists, often use these terms interchangeably. However in the most general terms, tree diagrams are known as “dendrograms” (after the Greek for tree), cladogram only represent a branching pattern; i.e., its branch spans do not represent time or relative amount of character change. While in contrast,trees known as phylograms or phylogenetic trees present branch lengths as being proportional to some measure of divergence between species and typically include a scale bar to indicate the degree of divergence represented by a given length of branch. Homology Vs Similarity Now you may say that since closely related species share a common ancestor and often resemble each other, it might seem that the best way to uncover the evolutionary relationships would be with overall similarity? Surprisingly the answer would be No, and to understand why is it so? we will have to look deeper into the difference between similarity and homology. Similarity may be misleading as because when unrelated species adopt a similar way of life, their body parts may take on similar functions and end up resembling one another due to convergent evolution and result in the formation of analogous features. One classical example is the wings of birds and bats. However when two species have a similar characteristic because it was inherited by both from a common ancestor, it is called a homologous feature (or homology). For example, the even-toed foot of the deer, camels, cattle, pigs, and hippopotamus is a homologous similarity because all inherited the feature from their common paleodont ancestor.
How to read a Phylogenetic tree?
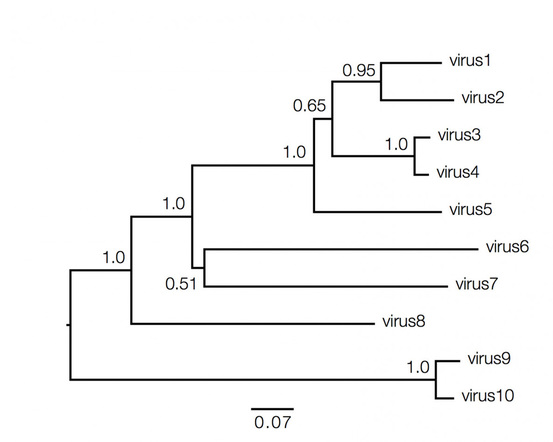
Phylogenetic trees contain a lot of information which can be both qualitative and quantitative, and decoding them is not always straightforward and requires understanding of the above basic facts. Consider the hypothetical tree of different viruses shown below:
Qualitatively here the length of the branches in horizontal dimension gives the amount of genetic change, thus the longer the branch is, larger is the amount of change. While the quantitative information regarding the amount of genetic change is given by the bar at the bottom of the figure which acts as a scale for this. In this case the line segment with the number '0.07' shows the length of branch that represents an amount genetic change of 0.07. The units of branch length are nucleotide substitutions per site – that is the number of changes or 'substitutions' divided by the length of the sequence. The scale may also sometimes represent the % change, i.e., the number of changes per 100 nucleotide sites.
However the vertical lines joining the nodes has no meaning and is used simply to lay out the tree for better visual understanding.
Different presentation schemes of evolutionary trees
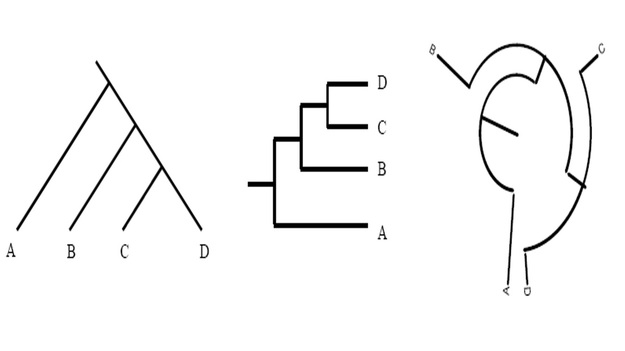
Unless indicated otherwise, a phylogenetic tree only depicts the branching history of common ancestry. The pattern of branching (i.e., the topology) is what matters here. Branch lengths are irrelevant. Thus, the three trees shown in here all contain the same information.
This might seem confusing to you at first, but however do remember that that the lines of a tree represent evolutionary lineages--and evolutionary lineages do not have any true position or shape. Therefore it doesn't matter whether branches are drawn as straight diagonal lines, or are kinked to make a rectangular tree, or are curved to make a circular tree.
To further simplify the concept, consider them as flexible pipes rather than rigid rods; similarly, nodes as swivel joints rather than fixed welds. The basic rule is that if you can change one tree into another tree simply by twisting, rotating, or bending branches, without having to cut and reattach branches, then the two trees have the same topology and therefore depict the same evolutionary history. Reference
0 Comments
|
AuthorHello! My name is Arunabha Banerjee, and I am the mind behind Biologiks. Leaning new things and teaching biology are my hobbies and passion, it is a continuous journey, and I welcome you all to join with me Archives
June 2024
Categories
All
|


 RSS Feed


